Dimensionality Reduction
Why this matters
Real datasets often have many columns. Some columns are redundant, some are noisy, and some only make sense together. High-dimensional data is harder to visualize, slower to model, and easier to overfit.
Dimensionality reduction tries to replace many original features with fewer new features while keeping the important structure. The notebook focuses on two classic linear methods:
- PCA: reduce dimensions by keeping directions with high variance.
- LDA: reduce dimensions by keeping directions that separate known classes.
The big study goal is not to hand-compute every matrix. It is to understand what information each method tries to preserve.
Mental model
Imagine a cloud of points in 3D. If most of the cloud lies near a tilted sheet, you can photograph it from the right angle and still see most of its structure in 2D.
That is the core idea:
Dimensionality reduction finds a useful lower-dimensional view of the data.
PCA asks:
Which viewing angle preserves the most spread in the whole dataset?
LDA asks:
Which viewing angle separates the labeled classes best?
Those sound similar, but they optimize different things. PCA can keep a direction with high variance even if it does not help classification. LDA can prefer a direction with less total variance if it separates classes better.
Core ideas
- Dimensionality reduction maps data from many original features to fewer new features.
- Feature selection keeps some original columns; feature extraction creates new columns from combinations of the originals.
- PCA is unsupervised: it ignores class labels.
- LDA is supervised: it uses class labels to find class-separating directions.
- PCA depends heavily on scaling. Standardize features before PCA when columns use different units.
- Eigenvectors describe directions; eigenvalues describe how important those directions are.
- Explained variance tells you how much of the original spread each principal component preserves.
- A lower-dimensional representation can help visualization, speed, compression, and sometimes model performance.
Walkthrough
Feature selection vs feature extraction
Suppose a dataset has these original columns:
| wine | alcohol | acidity | color intensity | proline |
|---|---|---|---|---|
| A | 13.2 | 2.1 | 5.6 | 1185 |
| B | 12.4 | 1.8 | 3.9 | 780 |
Feature selection might keep only alcohol and color intensity.
Feature extraction creates new features such as:
The new features are not original columns. They are new axes built from the old columns.
PCA: preserve the shape of the data
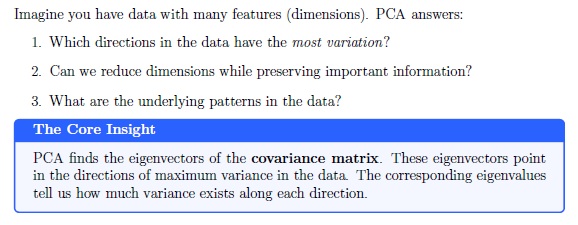
PCA stands for Principal Component Analysis. It finds new axes called principal components.
The first principal component is the direction where the data varies the most. The second principal component is the next strongest direction, with one constraint: it must be orthogonal to the first. The same idea continues for later components.
If the original data has many features, PCA can build a projection matrix that maps each example into fewer dimensions:
Here:
- the original features are one data point before compression
- the projection matrix defines the new PCA directions
- the compressed features are the lower-dimensional representation
The notebook uses the Wine dataset with 13 input features. A PCA with two components maps each wine from 13 numbers to 2 new numbers so the data can be plotted and classified in a simpler space.
Why standardization matters
PCA looks for high variance. If one feature is measured on a much larger scale, it can dominate the result.
Example:
alcoholmight range from 11 to 15.prolinemight range from 300 to 1700.
Without standardization, PCA may treat proline as more important mostly because its numeric scale is larger. Standardization puts features onto comparable scales before PCA finds directions.
The pattern is:
from sklearn.preprocessing import StandardScaler

scaler = StandardScaler()
X_train_std = scaler.fit_transform(X_train)
X_test_std = scaler.transform(X_test)
Fit the scaler on training data, then reuse it on test data. Do not fit preprocessing separately on the test set.
Covariance, eigenvectors, and eigenvalues
PCA uses the covariance matrix to understand how features move together.
- Positive covariance: two features tend to increase together.
- Negative covariance: one tends to increase when the other decreases.
- Near-zero covariance: no strong linear relationship.
The covariance matrix is then decomposed into eigenvectors and eigenvalues.
For PCA:
- Eigenvectors are principal-component directions.
- Eigenvalues say how much variance is captured in those directions.
You do not need to manually compute eigenvectors to use PCA in practice, but the idea matters: PCA is ranking directions by how much data spread they preserve.
Explained variance
The explained variance ratio answers:
How much of the total variance does this component keep?
If the first two components explain 60% of the variance, then a 2D PCA plot keeps a useful but incomplete view of the original data. It is not the whole dataset compressed perfectly. It is a lower-dimensional summary.
This is why choosing the number of components is a trade-off:
- Fewer components: simpler, faster, easier to visualize.
- More components: more information preserved, less compression.
LDA: preserve class separation
LDA stands for Linear Discriminant Analysis. Like PCA, it creates a lower-dimensional feature space. Unlike PCA, it uses class labels.
PCA asks for directions with high variance. LDA asks for directions that make classes easier to separate.
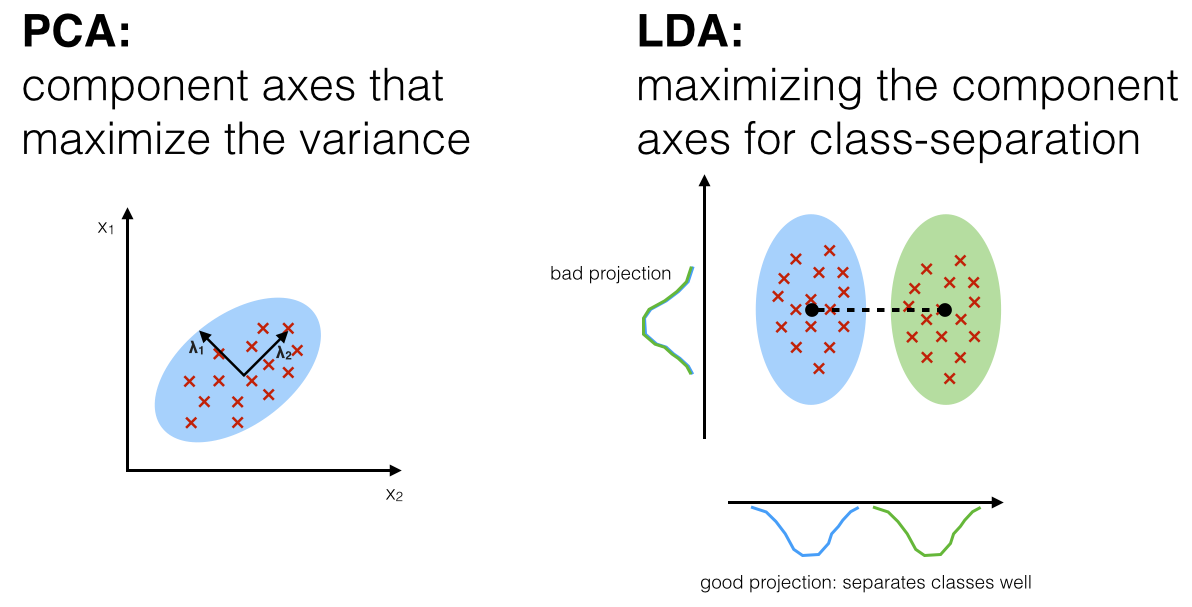
LDA tries to make this ratio favorable:
large distance between class means
----------------------------------
small spread within each class
In the Wine dataset, the labels are the wine classes. LDA uses those labels to find directions where the classes are far apart and internally compact.
PCA vs LDA in one table
| Question | PCA | LDA |
|---|---|---|
| Uses labels? | No | Yes |
| Main goal | Preserve variance | Separate classes |
| Typical use | Compression, visualization, preprocessing | Classification-oriented dimensionality reduction |
| Can be used before classification? | Yes | Yes |
| Maximum useful components | Up to number of original features | At most number of classes minus one |
The last row matters. If you have 3 classes, LDA can produce at most 2 meaningful discriminant axes. That is why the Wine example with 3 classes naturally maps well to 2 LDA dimensions.
Explained code examples
PCA with scikit-learn
from sklearn.decomposition import PCA
from sklearn.preprocessing import StandardScaler

scaler = StandardScaler()
X_train_std = scaler.fit_transform(X_train)
X_test_std = scaler.transform(X_test)

pca = PCA(n_components=2)
X_train_pca = pca.fit_transform(X_train_std)
X_test_pca = pca.transform(X_test_std)

print(pca.explained_variance_ratio_)
What this does:
StandardScalermakes feature scales comparable.PCA(n_components=2)asks for two principal components.fit_transformlearns the PCA directions from training data and transforms it.transformapplies the same learned directions to test data.explained_variance_ratio_reports how much variance each component preserves.
The important workflow rule is the same as in other machine-learning preprocessing: fit on training data, reuse on test data.
LDA with scikit-learn
from sklearn.discriminant_analysis import LinearDiscriminantAnalysis as LDA

lda = LDA(n_components=2)
X_train_lda = lda.fit_transform(X_train_std, y_train)
X_test_lda = lda.transform(X_test_std)
What this does:
LDA(n_components=2)asks for two discriminant dimensions.fit_transformneeds bothX_train_stdandy_trainbecause LDA uses labels.- The transformed features are designed to separate the classes, not merely preserve variance.
This is the key difference in code: PCA fits with X; LDA fits with X and y.
PCA before a classifier
from sklearn.linear_model import LogisticRegression
from sklearn.pipeline import make_pipeline

model = make_pipeline(
    StandardScaler(),
    PCA(n_components=2),
    LogisticRegression()
)

model.fit(X_train, y_train)
score = model.score(X_test, y_test)
This pipeline says:
- Standardize the features.
- Compress them to two PCA components.
- Train logistic regression on the compressed representation.
A pipeline helps avoid leakage because each preprocessing step is fit as part of the training workflow.
Common traps
Dimensionality reduction just deletes columns.
That is feature selection. PCA and LDA are feature extraction methods: they create new features from combinations of old ones.
PCA finds the best features for classification.
PCA ignores labels. It keeps variance, not necessarily class-discriminating information.
High variance always means useful signal.
High variance can be useful, but it can also be noise or irrelevant movement. PCA does not know the target labels.
Scaling is optional.
For PCA, scaling is often essential when features have different units or ranges.
A 2D PCA plot shows everything.
It only shows the information preserved by the selected components. Always check explained variance.
LDA always beats PCA for classification.
LDA can help when class separation is roughly linear and labels are reliable, but its assumptions may not fit every dataset.
Use PCA/LDA to make nonlinear problems magically linear.
PCA and LDA are linear transformations. Nonlinear structure may need other methods or models.
Check yourself
What is the difference between feature selection and feature extraction?
Feature selection keeps original columns. Feature extraction creates new features from combinations of original columns.
Why should features often be standardized before PCA?
PCA is sensitive to feature scale because it searches for directions with high variance. Large-scale features can dominate if data is not standardized.
What does an eigenvector represent in PCA?
A principal-component direction: an axis along which the data is projected.
What does an eigenvalue represent in PCA?
How much variance is captured along the corresponding eigenvector direction.
Why is PCA called unsupervised?
It does not use class labels. It only looks at the feature matrix.
What does LDA optimize that PCA does not?
LDA tries to maximize class separation: large between-class separation and small within-class spread.
If a dataset has 3 classes, what is the maximum number of useful LDA components?
At most 2, because LDA can provide at most number-of-classes minus one discriminant axes.
What should you check before trusting a 2D PCA representation?
The explained variance ratio, because it tells how much of the original variance the selected components preserve.
Source anchors
- Source file:
notebooks/Module2/05-Dimensionality Reduction.ipynb - Source dataset:
notebooks/Module2/Data/wine.data - Key source concepts: feature extraction, PCA, standardization, covariance matrix, eigenvectors, eigenvalues, explained variance, projection matrix, scikit-learn PCA, LDA, scatter matrices, class separability
- Source images:
study-guide/docs/assets/extracted/eigenvektor3.jpg,study-guide/docs/assets/extracted/comp_lda_pca.png