Cluster Analysis
New to clustering?
Start with Cluster Analysis: First Intuition if terms like feature space, distance, centroid, or noise are still unfamiliar.
Want one small code run first?
Read Cluster Analysis: k-Means in Code if you want to see cluster labels, centroids, and inertia on a tiny customer table before the full lesson.
Why this matters
Clustering is used when you have data but no labels. Instead of asking "can we predict the known answer?", clustering asks:
That makes it useful for customer segmentation, document grouping, image segmentation, anomaly detection, biology, recommender systems, and exploratory analysis.
The hard part is that there is usually no single correct answer. A clustering result depends on the features, distance metric, scaling, algorithm, and algorithm settings.
Mental model
Imagine placing pins on a map. If many pins are close together, you might call them a group.
Clustering does the same thing in feature space:
The details differ by algorithm:
- k-means looks for groups around centroids.
- hierarchical clustering builds a tree of merges.
- DBSCAN looks for dense regions and can mark isolated points as noise.
Core ideas
- Clustering is unsupervised learning: labels are not used to train the grouping.
- A cluster is a group of observations that are similar according to the chosen features and distance metric.
- k-means is prototype-based clustering: each cluster is represented by a centroid.
- k-means requires the number of clusters in advance.
- k-means works best when clusters are roughly round, similarly sized, and separable by distance.
- The elbow method helps choose a reasonable cluster count for k-means, but it is a heuristic.
- Silhouette score helps compare cluster separation by checking whether points are closer to their own cluster than to other clusters.
- k-means++ is a smarter centroid initialization strategy and is the practical default.
- Hierarchical clustering builds nested clusters and can be visualized with a dendrogram.
- DBSCAN is density-based: it can find non-round shapes and mark noise points.
- Feature scaling matters because clustering often depends directly on distance.
Walkthrough
Supervised vs unsupervised learning
In supervised learning, each training example comes with an answer:
In clustering, the answer is unknown:
customer behavior -> unknown groups
document text -> unknown topics
flower measurements -> unknown structure
The algorithm creates group labels such as 0, 1, and 2. Those labels are arbitrary names, not ground-truth classes.
k-means in one picture
k-means tries to represent each group by its center point, called a centroid.
The algorithm repeats this loop:
- Choose k initial centroids.
- Assign each point to the nearest centroid.
- Move each centroid to the average position of the points assigned to it.
- Repeat until assignments stop changing or the maximum iteration count is reached.
The objective is to make points close to their assigned centroids. Scikit-learn exposes this as inertia_, also called distortion or within-cluster sum of squared errors.
Plain-language version:
lower inertia -> points are closer to their assigned centers
higher inertia -> points are more spread out inside clusters
Lower is not always better by itself, because adding more clusters almost always lowers inertia. If every point became its own cluster, inertia would become tiny but the result would not be useful.
A simple k-means example
The notebook starts with synthetic two-dimensional blobs. That is a good teaching setup because the groups can be seen directly.
from sklearn.cluster import KMeans
from sklearn.datasets import make_blobs

X, y_true = make_blobs(
    n_samples=150,
    centers=3,
    n_features=2,
    cluster_std=0.60,
    random_state=0,
)

km = KMeans(
    n_clusters=3,
    init="k-means++",
    n_init=10,
    random_state=0,
)

y_cluster = km.fit_predict(X)
centers = km.cluster_centers_
What this teaches:
make_blobscreates data with visible groups.n_clusters=3tells k-means how many groups to find.fit_predictlearns the centroids and returns cluster labels.cluster_centers_stores the learned centroid positions.
Why initialization matters
k-means can start from different initial centroids. Bad starting points can lead to bad final clusters or slower convergence.
Two safeguards are common:
n_init=10: run k-means several times and keep the best run.init="k-means++": choose initial centroids that are spread out more intelligently.
In modern scikit-learn usage, k-means++ is the normal choice unless you have a reason to use a custom initialization.
Choosing k with the elbow method
k-means needs the cluster count before training. The elbow method tries several values of k and plots their distortions.
distortions = []

for k in range(1, 11):
    km = KMeans(n_clusters=k, init="k-means++", n_init=10, random_state=0)
    km.fit(X)
    distortions.append(km.inertia_)
You then look for the point where improvement starts slowing down:
k = 1 -> very rough grouping
k = 2 -> much better
k = 3 -> much better
k = 4 -> only a little better
If the curve bends sharply at k = 3, that is the "elbow" and suggests three clusters.
Important caveat: not every dataset has a clear elbow. The method gives evidence, not proof.
Justifying k with inertia or silhouette
When an exam asks you to justify a good number of clusters, do not only state the value of k. Explain the evidence.
Inertia supports a choice when the curve has an elbow:
large improvement up to k = 3
small improvement after k = 3
therefore k = 3 is a reasonable simpler choice
Silhouette score supports a choice when that k gives better separation:
higher silhouette -> points fit their own clusters better
lower silhouette  -> clusters overlap more or points sit between groups
Good answer pattern:
I compared several k values. Inertia suggests k = ... because the improvement slows after that point. Silhouette also supports k = ... because it has the highest or a clearly strong score. I choose k = ... because the metric evidence and the cluster interpretation agree.
If the metrics disagree, say so:
The evidence is mixed, so I would inspect the plot, centroids, and practical meaning of the extra cluster before deciding.
Clustering the Iris dataset
The notebook clusters Iris flowers by petal length and petal width.
This is useful because the real species labels exist, but k-means does not use them during clustering. You can cluster first, then compare the discovered groups with the known species afterward.
from sklearn.cluster import KMeans
from sklearn.datasets import load_iris

iris = load_iris(as_frame=True)
X_iris = iris.data[["petal length (cm)", "petal width (cm)"]]

km = KMeans(n_clusters=3, n_init=25, random_state=54321)
clusters = km.fit_predict(X_iris)
What this teaches:
- Known labels are useful for checking the result, but they are not part of unsupervised training.
- Using only two features makes visualization easier.
- More features may improve the clustering, but only if they add useful signal.
Text clustering
The notebook also clusters 20 Newsgroups documents. The pipeline is similar to sentiment analysis, but the goal is different.
Sentiment analysis:
Text clustering:
The notebook uses three categories: autos, space, and computer graphics.
from sklearn.cluster import KMeans
from sklearn.feature_extraction.text import TfidfVectorizer

vectorizer = TfidfVectorizer(stop_words="english")
X_text = vectorizer.fit_transform(texts)

kmeans = KMeans(n_clusters=3, random_state=0)
kmeans.fit(X_text)

clusters = kmeans.predict(X_text)
After fitting, the notebook inspects the top words near each centroid:
terms = vectorizer.get_feature_names_out()
centroids = kmeans.cluster_centers_.argsort()[:, ::-1]

for cluster_id in range(3):
    top_terms = [terms[i] for i in centroids[cluster_id, :10]]
    print(cluster_id, top_terms)
What this teaches:
- TF-IDF turns documents into numerical vectors.
- k-means can cluster documents in that vector space.
- Top centroid terms help interpret what each cluster represents.
- Cluster labels such as
0,1, and2have no meaning until you inspect them.
Hierarchical clustering
Hierarchical clustering does not begin by choosing a fixed number of clusters. Instead, it builds a hierarchy.
The agglomerative version works bottom-up:
- Start with each observation as its own cluster.
- Find the two closest clusters.
- Merge them.
- Repeat until everything is one large cluster.
The result can be shown as a dendrogram.
short merge height -> very similar observations
tall merge height -> less similar groups are being joined
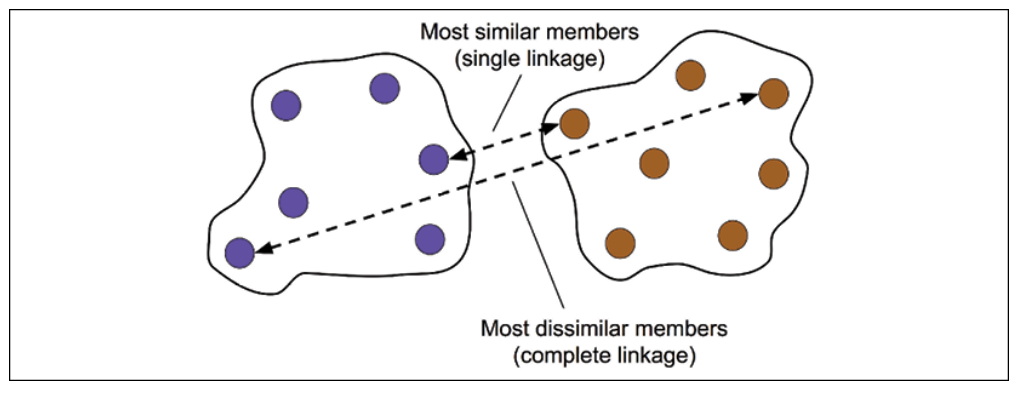
The notebook focuses on complete linkage. Complete linkage measures the distance between two clusters using their most distant pair of points. This tends to create tighter, more compact clusters than single linkage.
Linkage matrices and dendrograms
The notebook creates a small five-row dataset and computes pairwise distances.
from scipy.cluster.hierarchy import dendrogram, linkage
from scipy.spatial.distance import pdist

row_clusters = linkage(
    pdist(df, metric="euclidean"),
    method="complete",
)

dendrogram(row_clusters, labels=df.index)
What this teaches:
pdistcomputes pairwise distances in condensed form.linkagerecords the sequence of cluster merges.dendrogramvisualizes those merges as a tree.- You can cut the tree at a chosen height to obtain a practical number of clusters.
DBSCAN
DBSCAN stands for density-based spatial clustering of applications with noise.
The key idea is density:
DBSCAN classifies points as:
- core point: has enough neighbors inside a chosen radius
- border point: is near a core point but does not have enough neighbors itself
- noise point: is not close enough to a dense region
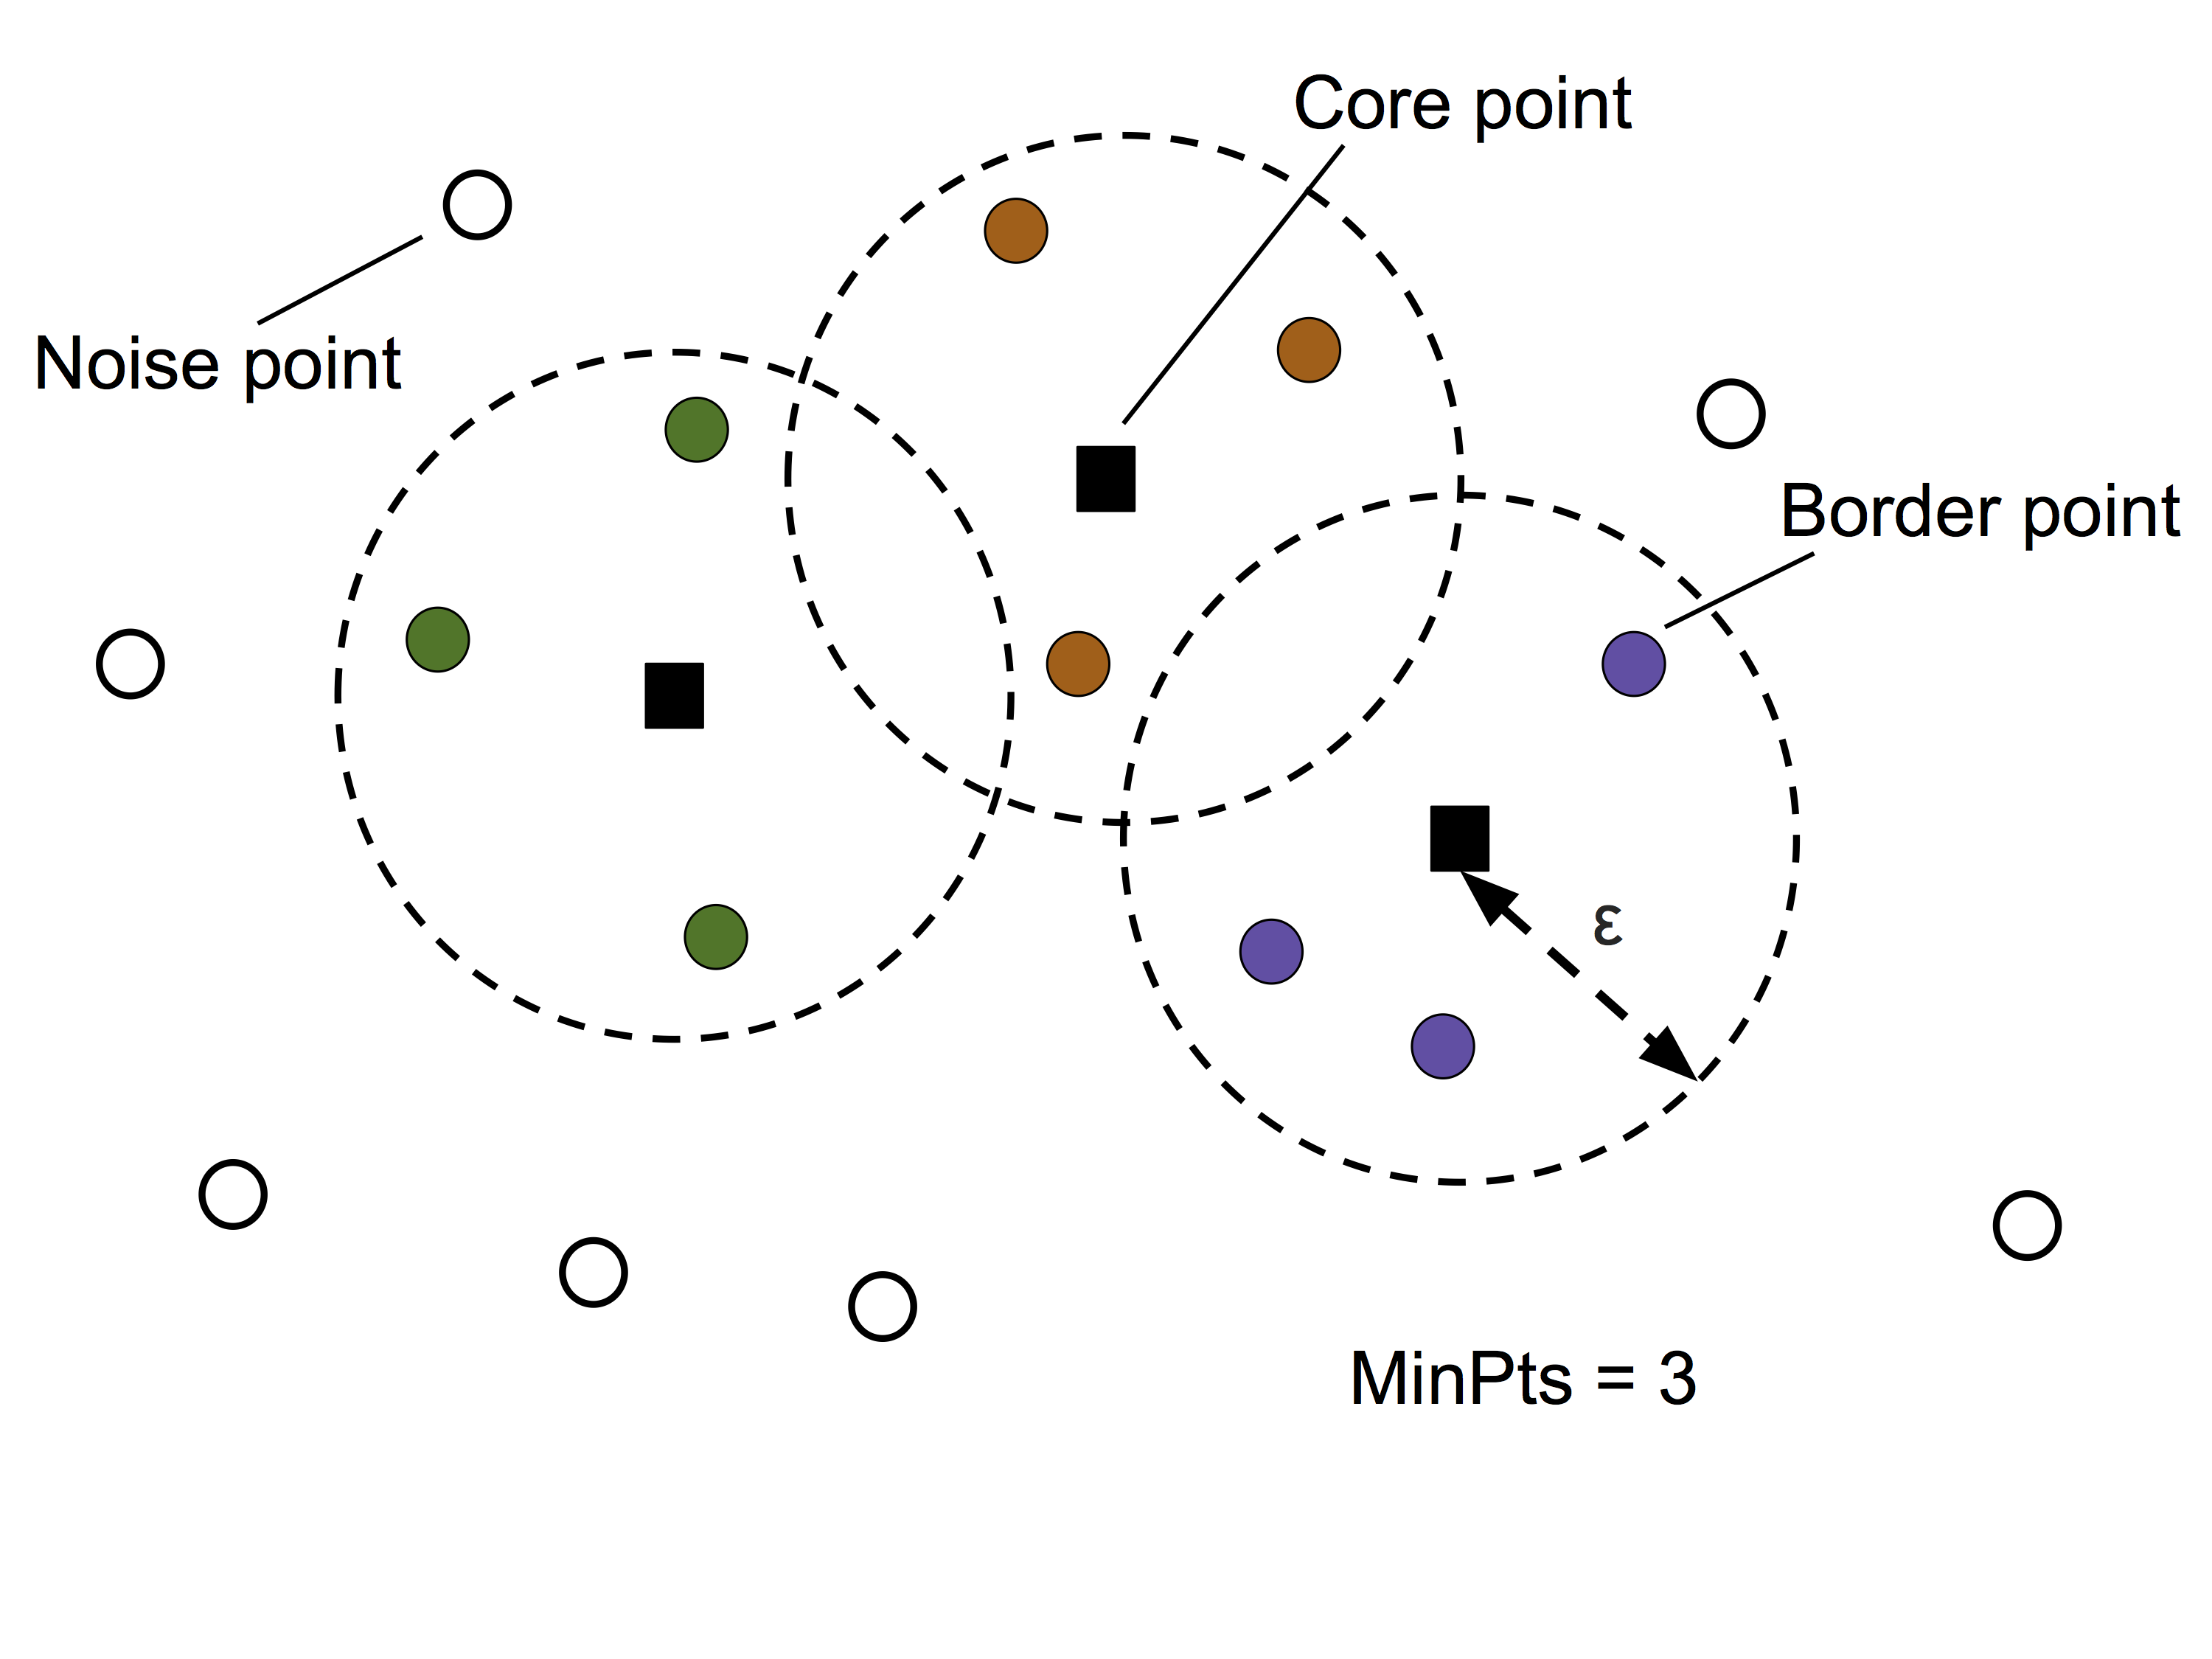
The two main settings are:
eps: the neighborhood radiusmin_samples: how many nearby points are needed for a dense region
Why DBSCAN helps on non-round clusters
k-means expects clusters that can be represented well by centroids. That works badly for shapes like two interlocking half-moons.
DBSCAN can work better because it follows density instead of center distance.
from sklearn.cluster import DBSCAN
from sklearn.datasets import make_moons

X, y = make_moons(n_samples=200, noise=0.05, random_state=0)

db = DBSCAN(eps=0.2, min_samples=5, metric="euclidean")
labels = db.fit_predict(X)
What this teaches:
- DBSCAN does not require
n_clusters. - DBSCAN can discover irregular shapes.
- DBSCAN can label points as noise using
-1. - DBSCAN is sensitive to
epsandmin_samples.
Choosing Between Methods
Use k-means when:
- you need a fast baseline
- you can choose a reasonable number of clusters
- clusters are roughly round and distance-based
- you want simple centroids for interpretation
Use hierarchical clustering when:
- you want a cluster tree
- the dataset is small or medium-sized
- you want to inspect nested structure
- a dendrogram would help communicate the result
Use DBSCAN when:
- clusters may have irregular shapes
- noise and outliers matter
- you do not want to specify the number of clusters upfront
- the data has meaningful local density
Common traps
Do not treat cluster labels as true class labels
Cluster 0 is just a name assigned by the algorithm. It is not automatically a real-world category.
Do not forget feature scaling
Distance-based clustering can be dominated by whichever feature has the largest numeric range.
Do not choose k only from the lowest inertia
Inertia usually decreases as k increases. Use the elbow pattern and domain judgment, not the raw minimum alone.
Do not expect k-means to find every cluster shape
k-means works best for compact, roughly round clusters. Curved or irregular clusters may need another method.
Check whether the features encode the similarity you care about
Clustering will group points according to the provided representation, even if that representation misses the real question.
Tune DBSCAN's eps deliberately
A poor radius can turn everything into one cluster or mark everything as noise.
Inspect text clusters before interpreting them
Top terms and example documents are needed before assigning meaning to a text cluster.
Check yourself
Why does k-means need the number of clusters before training?
k-means is designed to find a fixed number of centroids. The value of k tells it how many centroids, and therefore how many clusters, to optimize.
Why does inertia usually decrease as k increases?
More centroids give points more nearby centers to choose from. That usually lowers within-cluster distance, even if the extra clusters are not meaningful.
What does k-means++ improve compared with random centroid initialization?
It chooses initial centroids more carefully so they are spread out, which often improves stability and convergence.
Why are cluster IDs arbitrary?
Labels such as 0, 1, and 2 are just names assigned by the algorithm. They do not automatically correspond to real-world categories.
Why can TF-IDF vectors be clustered with k-means?
TF-IDF turns each document into a numerical vector. Once text is numerical, distance-based algorithms such as k-means can group similar vectors.
What does a dendrogram show?
It shows the sequence of merges in hierarchical clustering and the distances at which clusters were joined.
Why can DBSCAN handle half-moon-shaped clusters better than k-means?
DBSCAN follows dense connected regions instead of representing each cluster by a centroid, so it can capture curved or irregular shapes.
What happens if eps is too small in DBSCAN?
Neighborhoods become too small, so many points may fail to connect to dense regions and get labeled as noise.
Next
Next: Neural Networks: First Intuition
That bridge starts the neural-network sequence with the plain learning loop before the full lesson introduces perceptron, ADALINE, gradient descent, and backpropagation.
Source anchors
This lesson rewrites the main ideas from 08-Cluster Analysis.ipynb:
- unsupervised learning and clustering motivation
- k-means on synthetic blob data
- centroid initialization and k-means++
- inertia and the elbow method
- Iris clustering
- text clustering with TF-IDF and k-means
- agglomerative hierarchical clustering and dendrograms
- DBSCAN, core/border/noise points, and half-moon data